Review traces
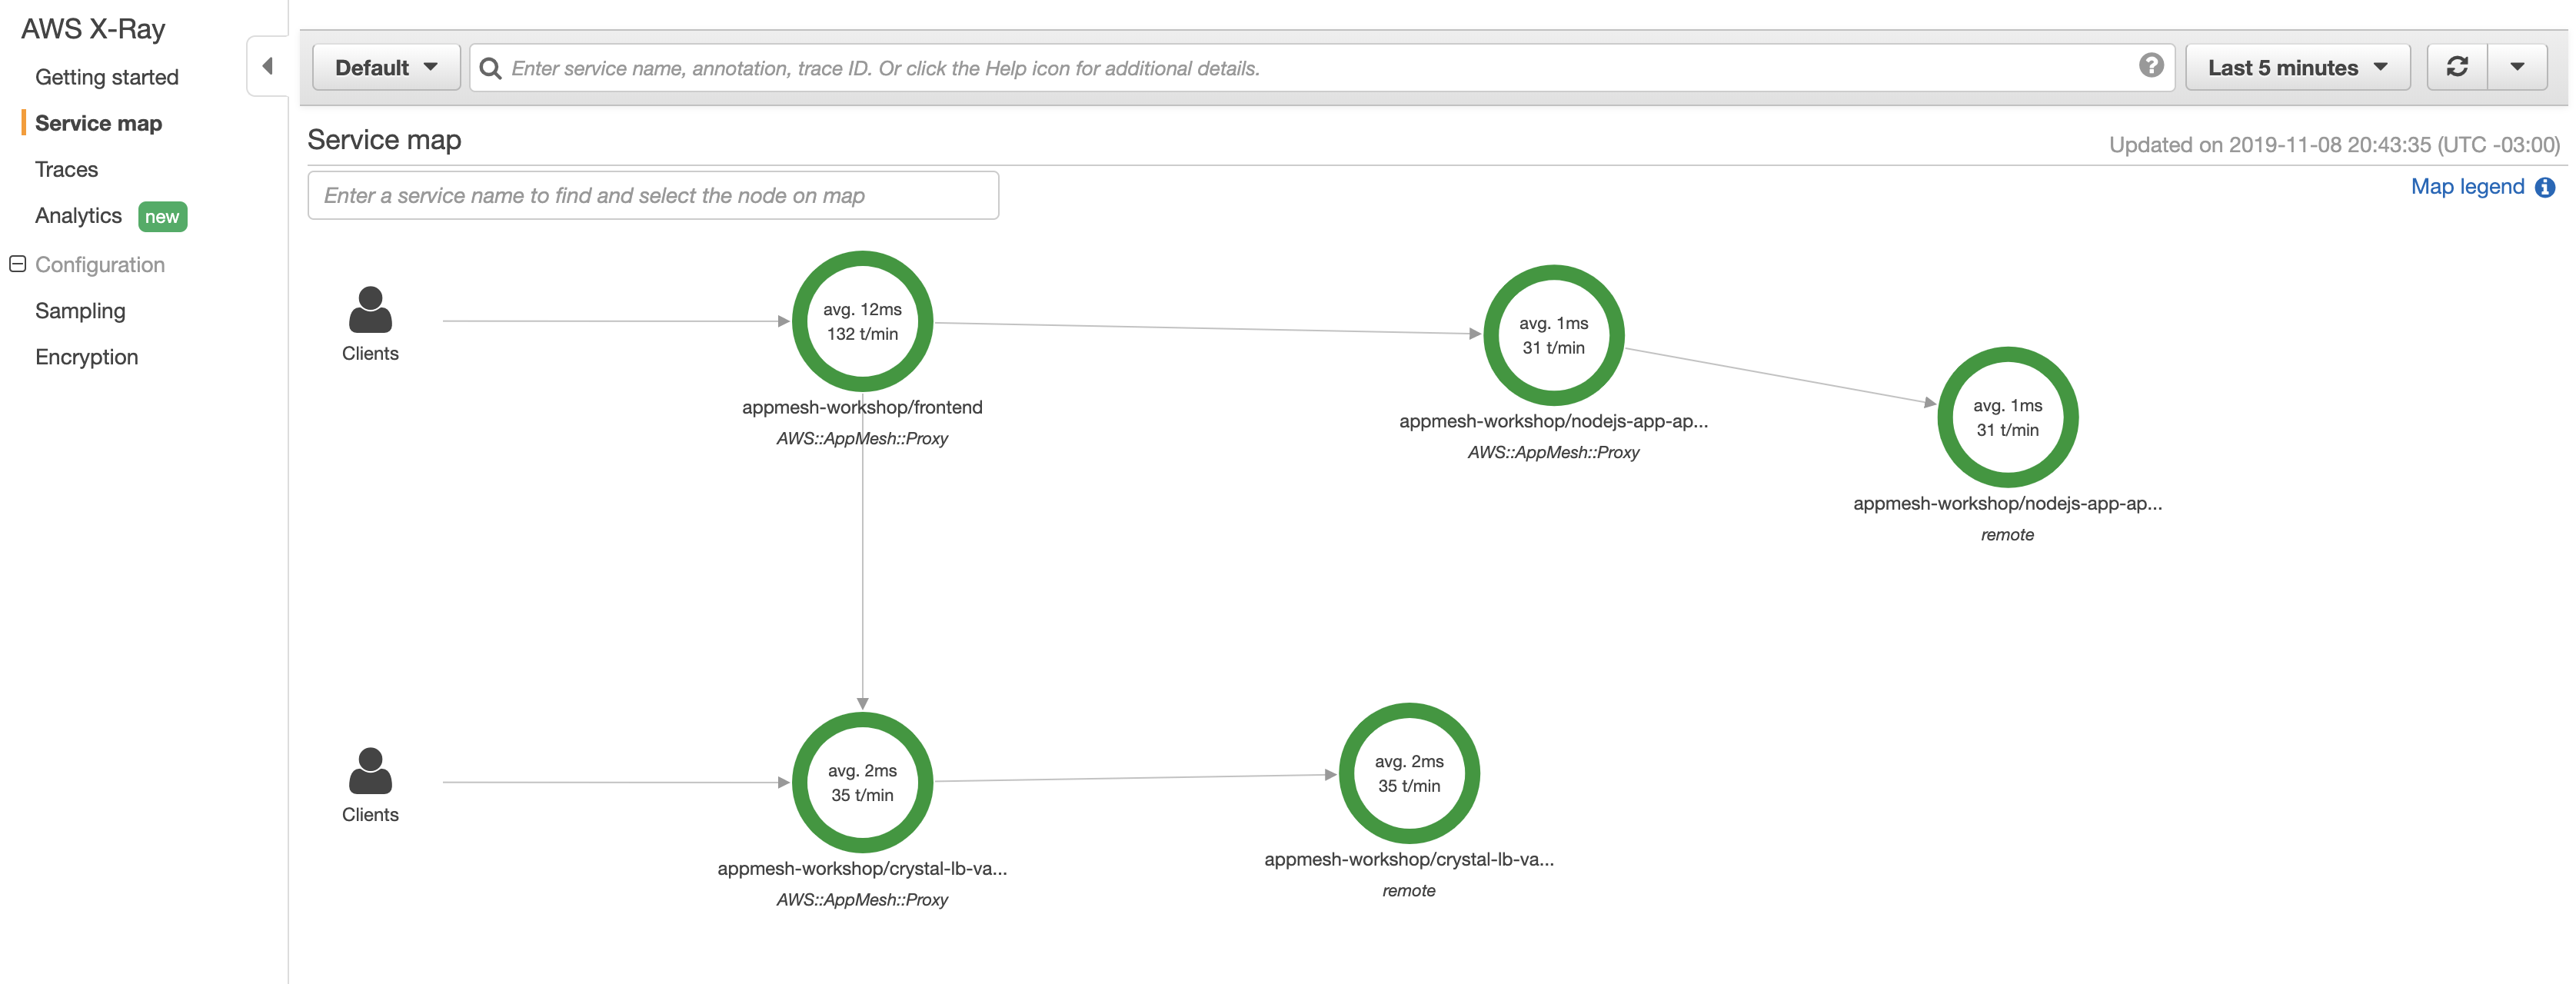
Now access the X-Ray console. Once in the X-Ray console, select Service Map from the left hand side menu. Wait a few seconds for the service map to render.
You will see something like this:

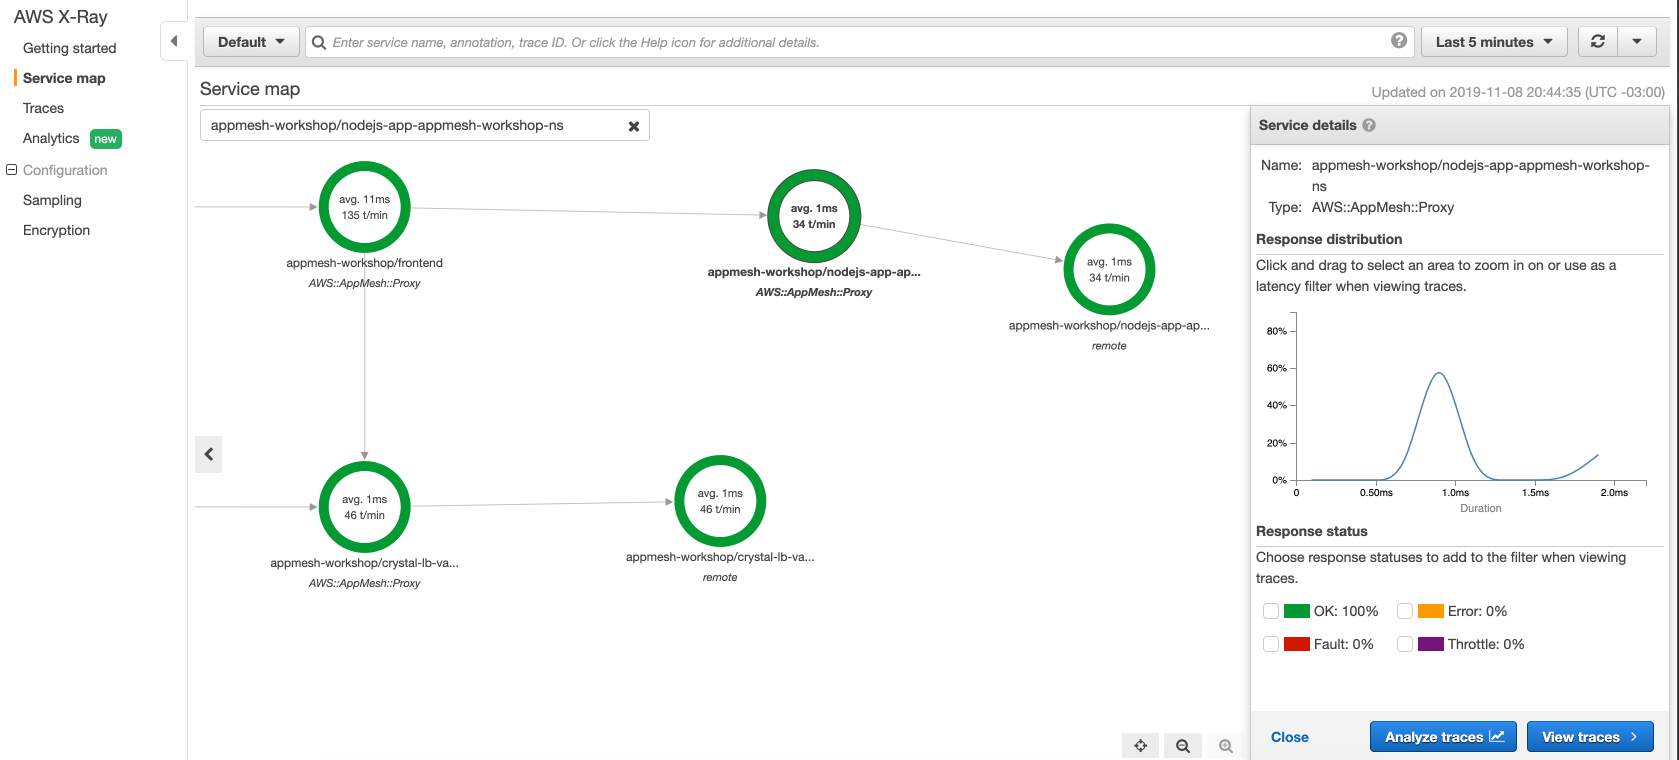
Whenever you select a node or edge on an AWS X-Ray service map, the X-Ray console shows a latency distribution histogram. Latency is the amount of time between when a request starts and when it completes. A histogram shows a distribution of latencies. It shows duration on the x-axis, and the percentage of requests that match each duration on the y-axis.
